 Joymista
FEAR & GREED
Crypto fear and greed index
The index measures the crypto market’s mood from 0 to 100. You see today’s reading and its zone, from “Extreme fear” to “Extreme greed”, compare it with yesterday, last week and last month, and see each day as a coloured square over a month, 3 months or a year.
Open the tool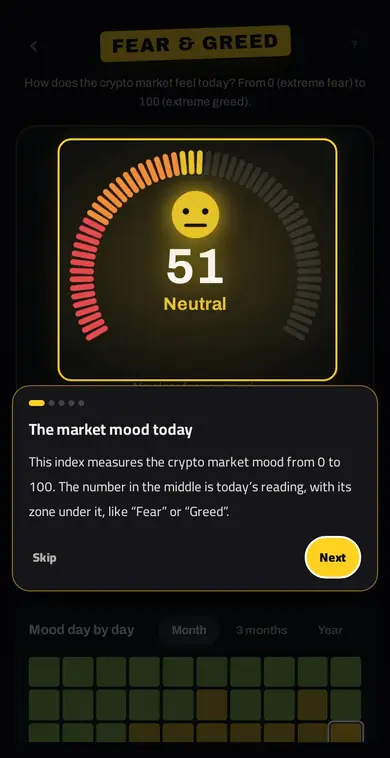
How to use it
- The market mood todayThis index measures the crypto market mood from 0 to 100. The number in the middle is today’s reading, with its zone under it, like “Fear” or “Greed”.
- Where we are on the scaleThe bar is split into five zones, from “Extreme fear” in red to “Extreme greed” in green. The white mark is today’s reading.
- Compared with beforeCompare today with “Yesterday”, “Last week” and “Last month”, to see whether fear or greed is growing.
- Day by dayEach square is a day, coloured by its zone. Pick “Month”, “3 months” or “Year”, and tap any square to see its reading.
- How to use itThe index describes people’s mood; it does not predict the price. Open “How to read it?” and “What goes into it?” to learn more.
Why it helps
Extreme fear pushes people to sell at a loss; extreme greed pushes them to buy at the top. The index describes mood and does not predict price, but it reminds you to ask: is my decision based on analysis or on the market’s mood?
FAQ
What is the fear and greed index?
A number from 0 to 100 describing the crypto market’s mood: near 0 is extreme fear, near 100 extreme greed.
Does it predict bitcoin’s price?
No. It describes mood, not a price forecast, and is best used alongside your analysis.
Can I see past readings?
Yes. Each square in the tool is a day; tap it to see its reading.
Related tools
Try it in Joymista
Signing up is free, some tools are free, and one subscription unlocks the rest.
Open the toolEducational content, not investment advice.