 Joymista
ORDER FLOW
Order flow and footprint candles
The tool shows footprint candles, how much was bought and sold at each price inside the candle, imbalances and the point of control. Under the chart are delta and CVD, with liquidations, open interest, funding and the long-to-short ratio.
Open the tool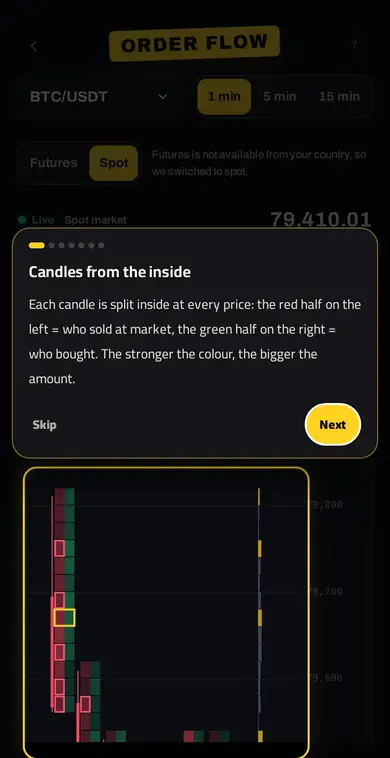
How to use it
- Footprint candlesTap any candle to see what was bought and sold at each price inside it, and the imbalances.
- Delta and CVDUnder the chart is the buy-minus-sell difference per candle and its running total.
- Liquidations and open interestSee big liquidations, open interest, funding and the long-to-short ratio.
- The guideA first tour points at the screen, then a live line explains what is happening now and what it means.
Why it helps
A normal candle tells you where price opened and closed; order flow tells you who pushed it, buyers or sellers, and whether there was absorption or a push. That is hard for beginners, so a guide points at the screen and explains in plain words what is happening now, and any part you tap explains itself.
FAQ
What is order flow?
Reading the trades actually executed to see who controls price, buyers or sellers, instead of the candle’s shape alone.
What is a footprint chart?
Candles that show buy and sell volume at each price inside them, so you see where the fight took place.
What is CVD?
The running total of market buys minus market sells over time. Price up while CVD falls is a divergence worth noticing.
Related tools
Try it in Joymista
Signing up is free, some tools are free, and one subscription unlocks the rest.
Open the toolEducational content, not investment advice.