 Joymista
SIMILAR PAST
The market now against similar past moments
The tool searches the past for 10 moments when the market looked like it does now and shows what came next: how often it rose, the expected candles from the similar cases, and the usual range around them. Pick gold, a currency, a stock or a coin; the timeframe sets itself.
Open the tool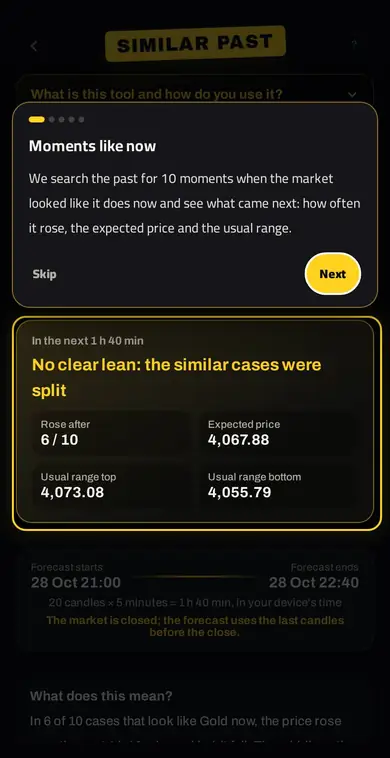
How to use it
- Moments like nowWe search the past for 10 moments when the market looked like it does now and see what came next: how often it rose, the expected price and the usual range.
- The chartThe current candles, then the expected candles from the similar cases; the area around them is the "Usual range" where the price mostly stayed.
- The forecast windowWhen the forecast starts and ends, in your device's time. It updates with every new candle.
- Pick the marketPick gold, a currency, a stock or a crypto coin. The "Timeframe" is set automatically by the kind of market.
- The ten casesOpen it to see each case's date, how closely it matches now and where the price ended after it. Use it as a picture of what happened before, not a promise.
Why it helps
Markets never repeat exactly, but seeing what happened after similar cases gives you a sense of the odds and the usual range. Open the ten cases to see each date, how closely it matches and where price ended, and use it as a possibility next to your analysis, not a forecast.
FAQ
How does it find similar moments?
It compares the current move with past moves and picks the 10 closest cases, showing how closely each one matches.
Is this a price forecast?
No. It shows what followed similar cases, to be used as a possibility, not a prediction.
When does it update?
With every new candle.
Related tools
Try it in Joymista
Signing up is free, some tools are free, and one subscription unlocks the rest.
Open the toolEducational content, not investment advice.