 Joymista
CORRELATION MATRIX
Correlation between pairs, metals and indices
Pick the pair, metal or index you trade and the tool shows two lists, what moves with it and what moves against it, with a correlation score from −1 to +1. You set the timeframe and the number of candles, and can open any symbol for a plain explanation and a chart comparing the two.
Open the tool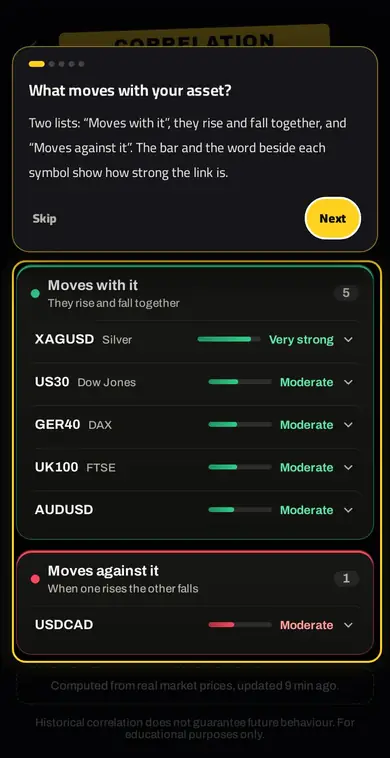
How to use it
- What moves with your asset?Two lists: “Moves with it”, they rise and fall together, and “Moves against it”. The bar and the word beside each symbol show how strong the link is.
- Pick your assetIn “The asset you trade”, choose the pair, metal or index you care about, and its links with the other assets appear.
- Timeframe and candles“Timeframe” sets the candle size and “Candles” sets how long a period is measured. Fewer candles give a fresher but less stable picture.
- Open any symbolTap any symbol to see a plain explanation, a chart comparing both assets, and the “Correlation score” from −1 to +1.
- Before you open two tradesTwo trades in the same direction on assets that move together mean doubled risk. Buying two assets that move opposite makes the trades nearly cancel out.
Why it helps
Two trades in the same direction on strongly correlated assets double your risk without you noticing, and buying two assets that move against each other can cancel one out. Correlation changes over time, so it is worth measuring on a recent period before you open more than one trade.
FAQ
What does forex correlation mean?
It measures how often two pairs move in the same direction. Close to +1 means they usually move together, close to −1 that they move against each other, and near zero that there is no clear link.
Which pairs are correlated with gold?
It changes with time and the period you measure. Pick gold in the tool to see what moves with it or against it right now on your timeframe.
Is correlation stable?
No. It shifts with market conditions. Fewer candles give a fresher reading; more candles give a longer, steadier picture.
Related tools
Try it in Joymista
Signing up is free, some tools are free, and one subscription unlocks the rest.
Open the toolEducational content, not investment advice.